
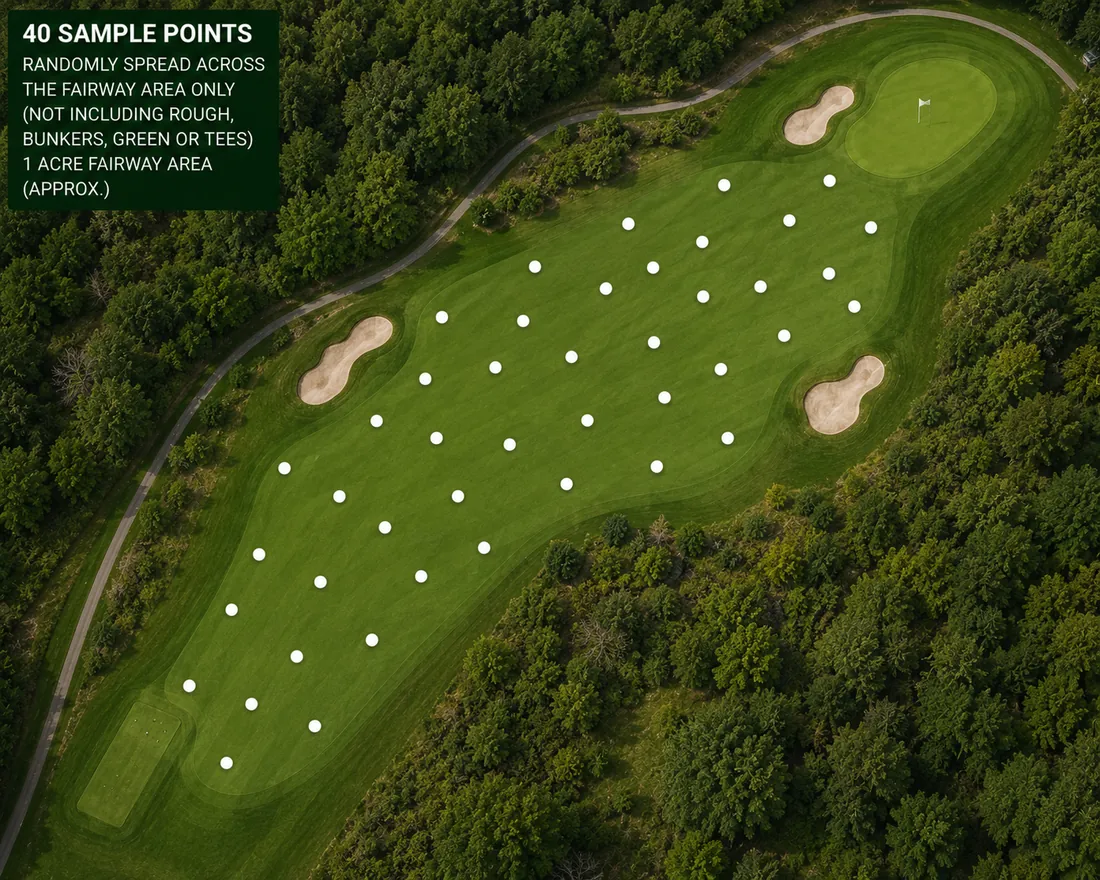
Fairway array
A staggered grid down the corridor picks up the drainage and traffic patterns that make one half of a fairway behave differently from the other.
Applications
Two to four samples per 1,000 ft² is the statistical answer. Where those samples go is the practical one — and it changes with the shape of the surface and the way it is played. These are the arrays we use.
Golf
Playability without the guesswork — greens dialled in for speed and firmness, fairways managed for consistency across a corridor that rarely behaves the same way twice.
A staggered grid down the corridor picks up the drainage and traffic patterns that make one half of a fairway behave differently from the other.
Small, high-stakes surfaces where two to four samples per 1,000 ft² is a handful of readings — and where the pattern must cover the high shoulder, the low collection point and the middle, or the map lies.
TOMi™ carries putting-green patterns for small, medium and large surfaces so the array scales with the green rather than being reused blindly.
Concentrated wear, irregular shapes and irrigation that was designed for something else. Sampling here catches the divot-zone moisture that a green-focused programme misses entirely.
Sports pitches
Pitch sports concentrate wear in predictable places. The array follows the game.
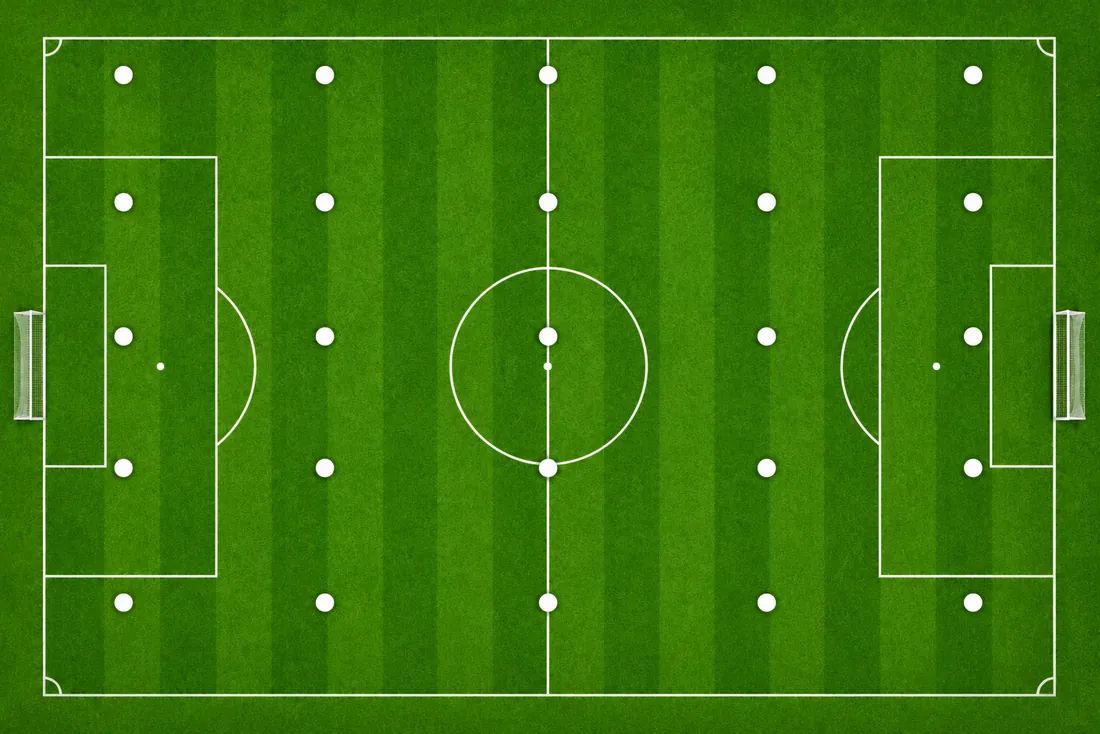
Full-pitch coverage that weights goalmouths and the centre corridor, where wear and compaction concentrate.
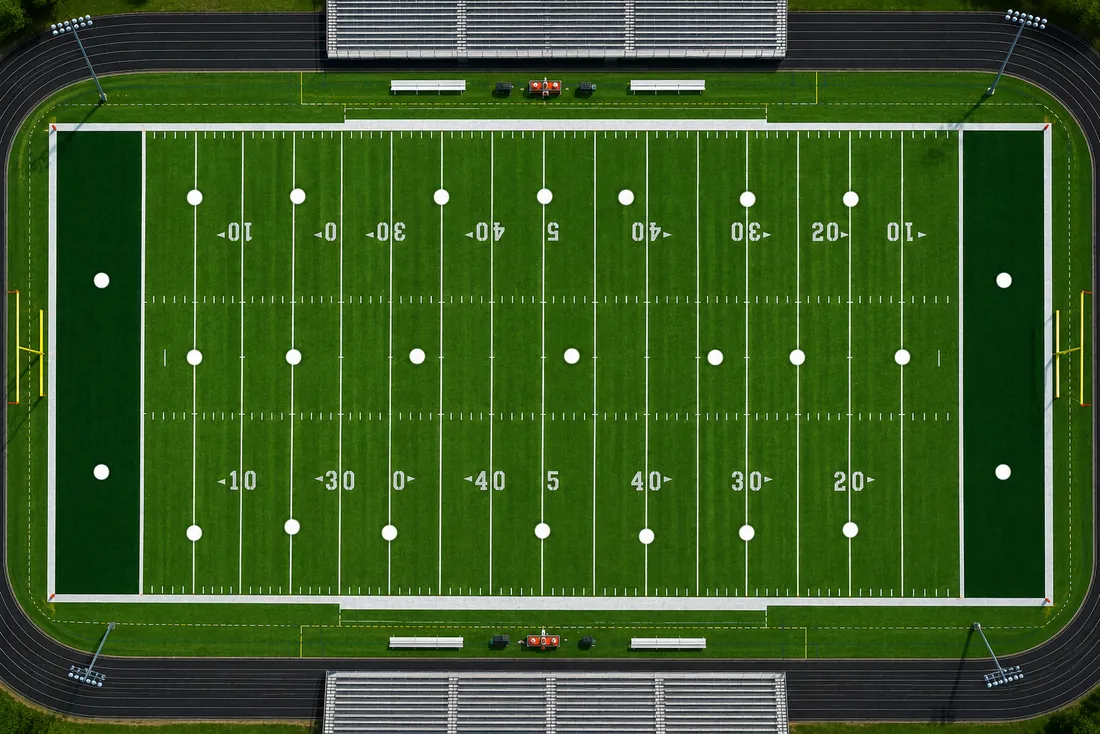
Hash-mark and between-the-twenties concentration, where the surface takes the heaviest, most repeated load.
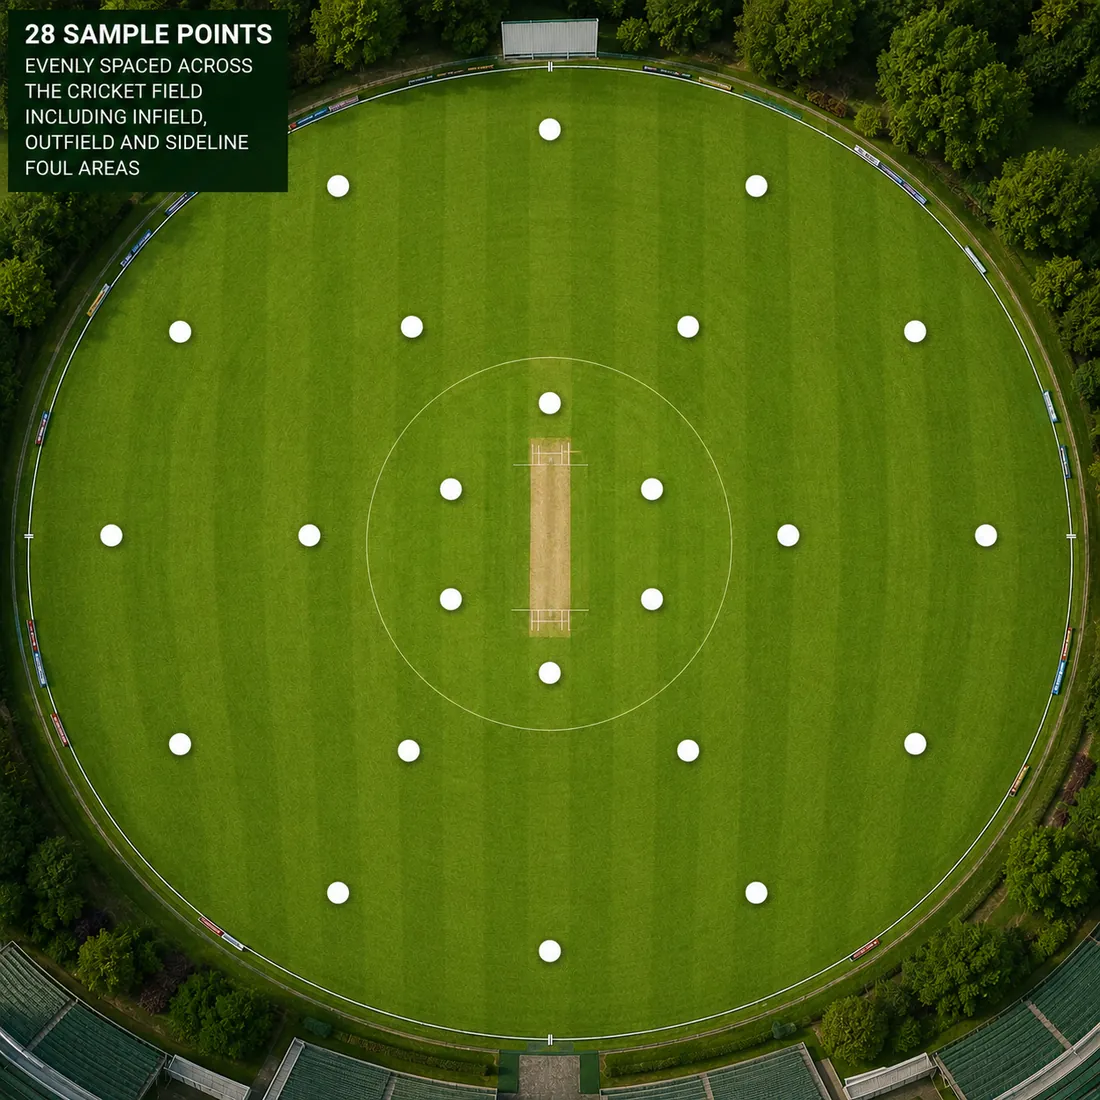
The square and the outfield are two different surfaces with two different jobs. They get sampled as such.
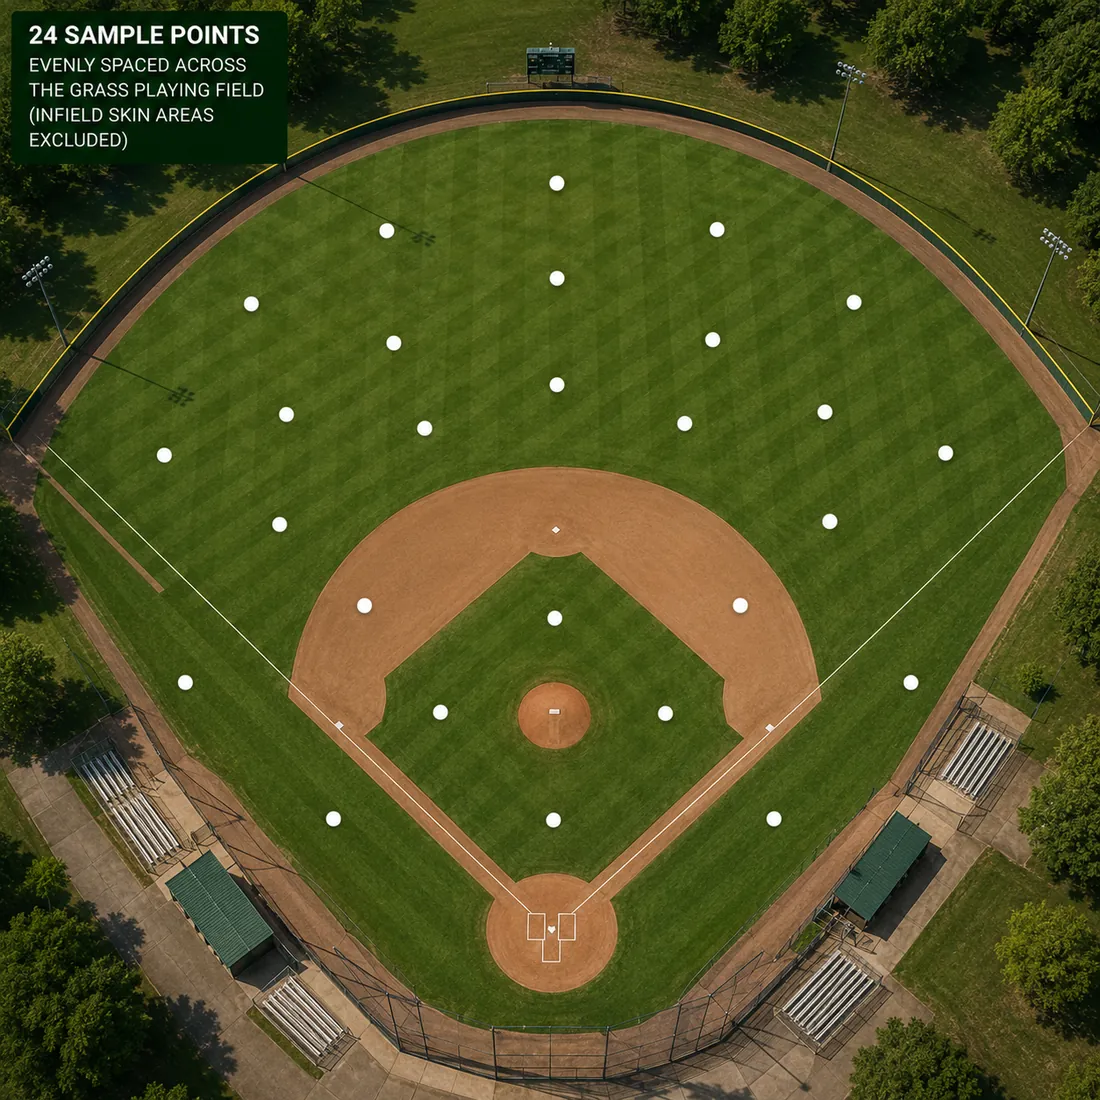
Infield, base paths and outfield sampled separately, because a skinned infield edge and deep centre never share a condition.
Racing
A racing surface is measured along its length, not across a box. Two patterns cover it: a zig-zag that samples the running line and both rails as it travels, and a 2×2 grid for detailed section work.
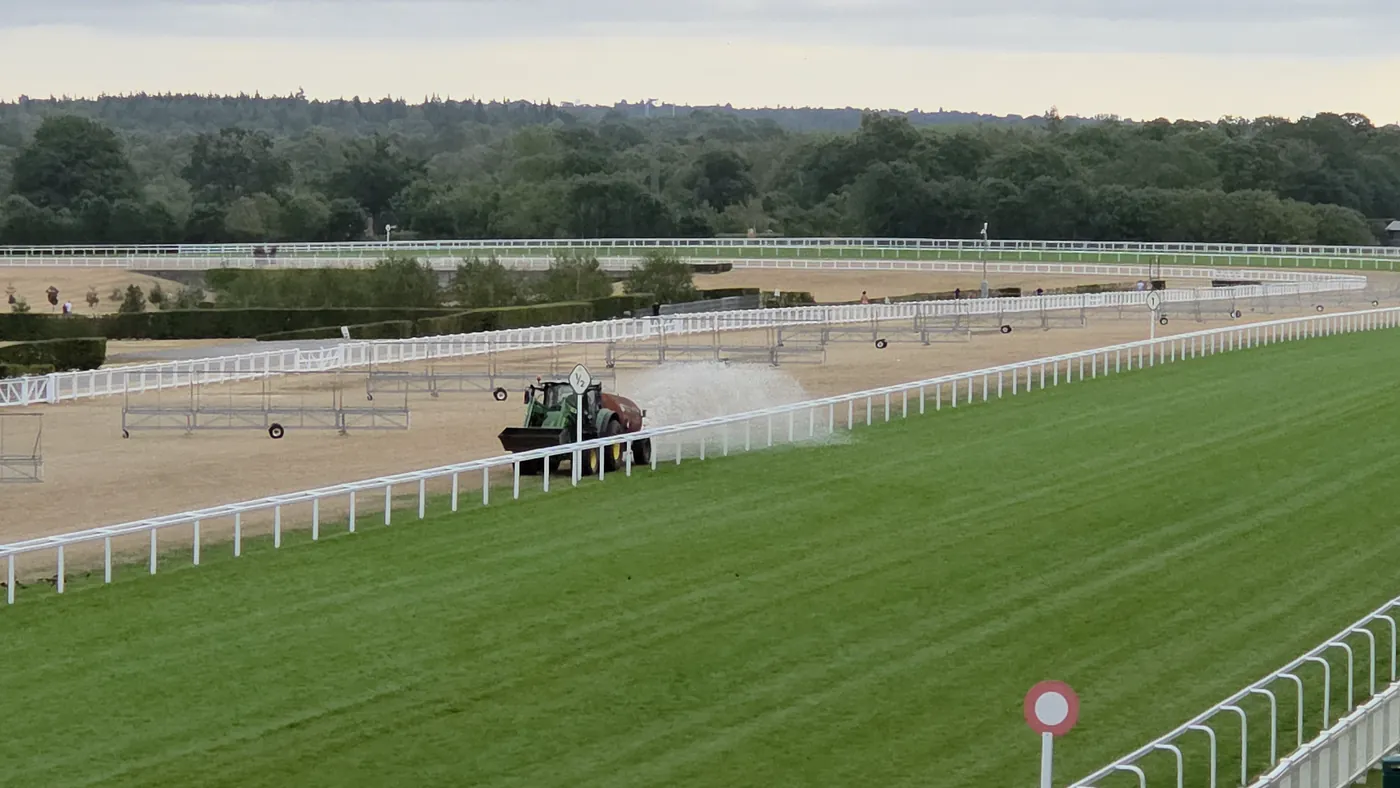
Consistency down the straight and through the bends is what the going description is trying to summarise. Measured moisture makes that description defensible — and makes the watering decision before a meeting a matter of record rather than of opinion.
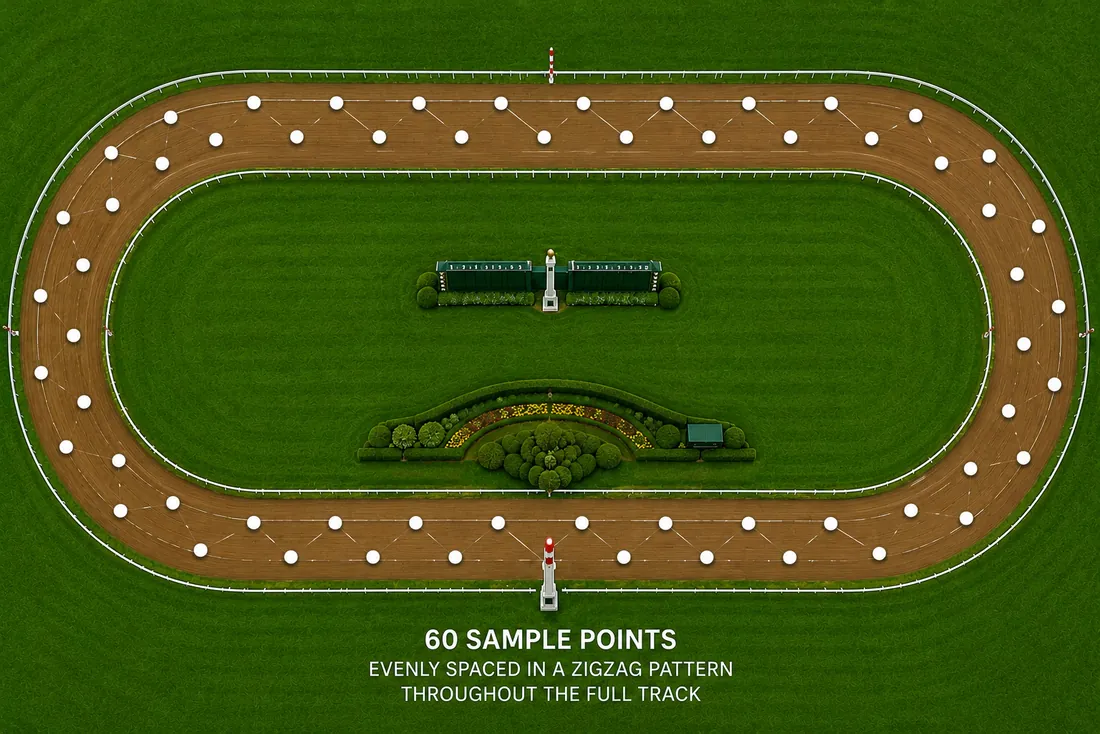
Travelling coverage of the running line and both rails.
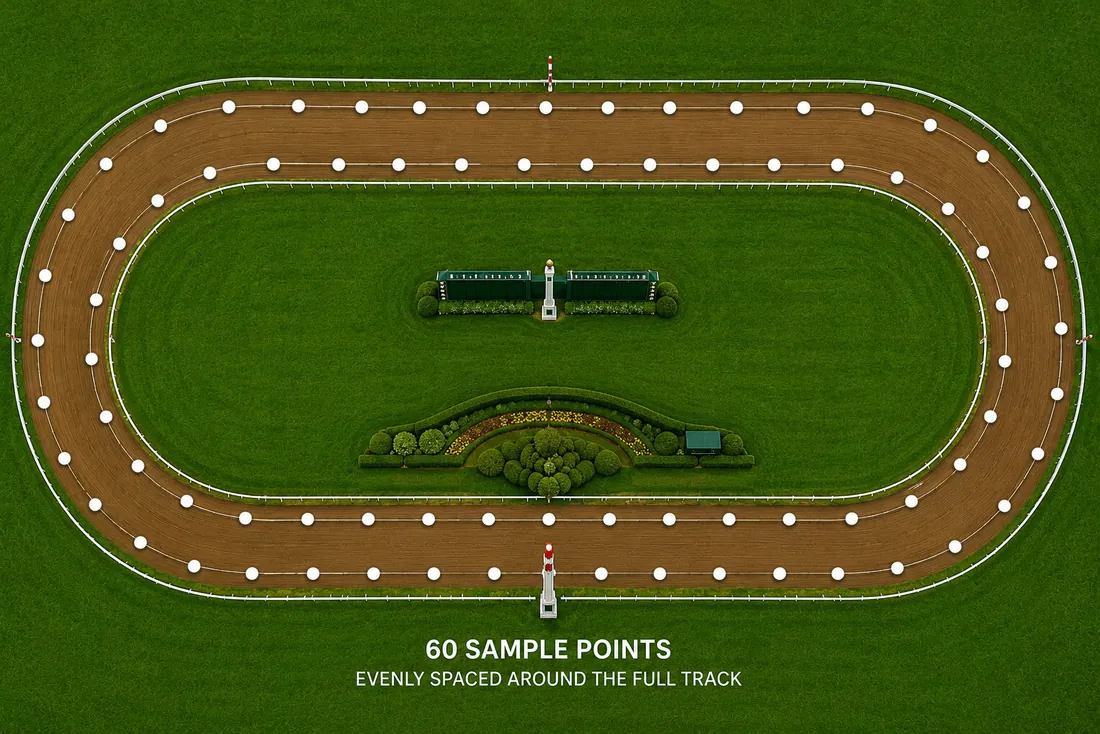
Detailed section work where a problem has been identified.
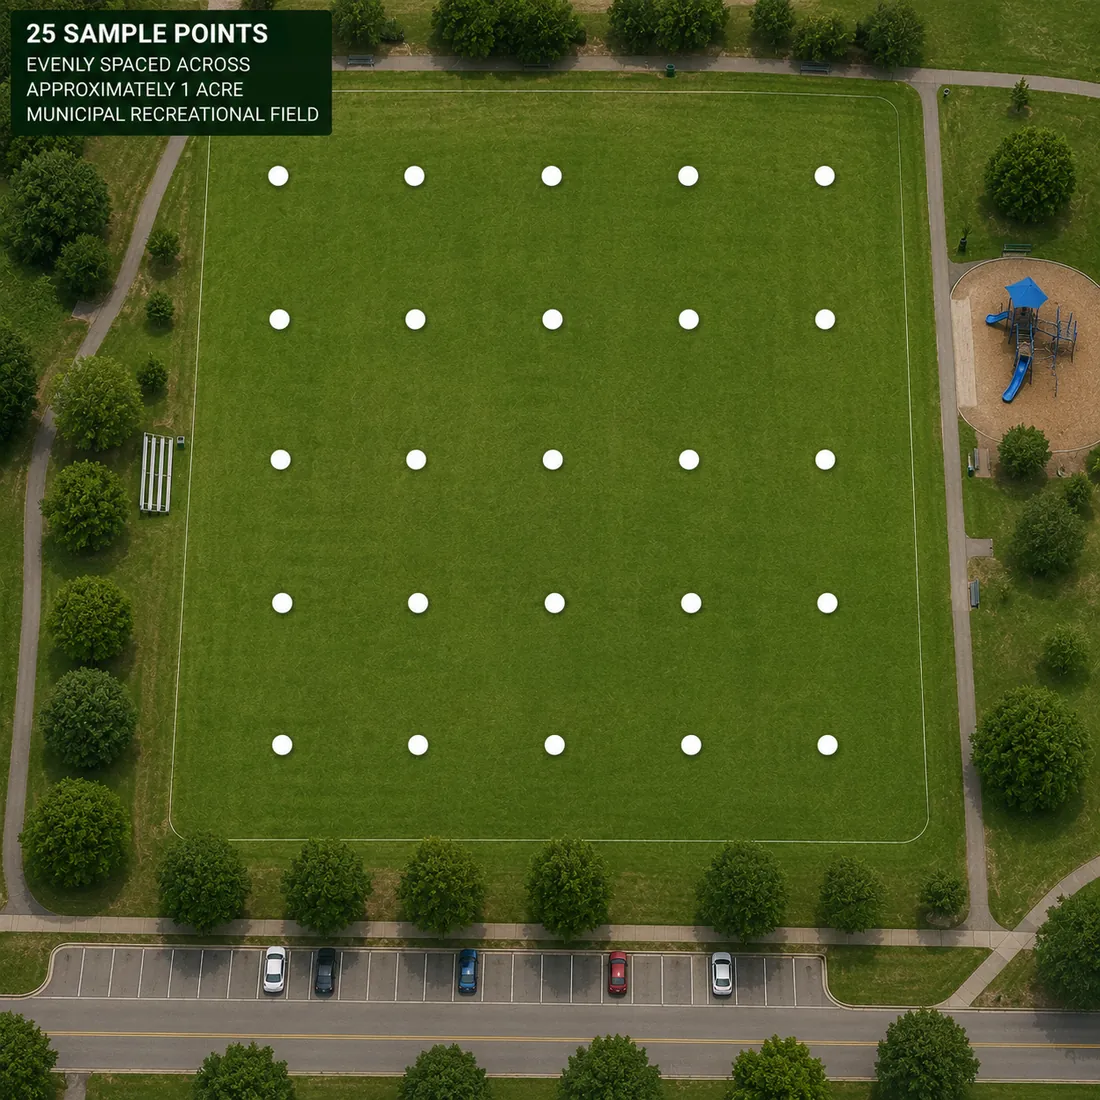
Coverage for irregular, multi-use ground where the pitch markings move between seasons.
Municipal & recreational
Parks and community pitches carry the heaviest use with the least resource. Measurement is how a small team justifies where the water and the money go — and proves the ground was safe to play on.
Time-stamped records of environmental conditions and management responses give councils, boards and governing bodies something better than an assurance: evidence.
Tell us what you manage and how it’s used. We’ll tell you honestly what a sound sampling programme looks like for it.