
It’s not about run time
Irrigation decisions made on minutes rather than measured condition are decisions made blind. What matters is where the rootzone actually sits relative to where you want it tomorrow.
The science
Thirty years of turfgrass research sit behind every number TOMi™ puts on screen. This is the short version of why it measures what it measures, where it measures it, and how many readings a surface actually needs.
Moisture
Moisture is the single biggest lever in turf performance — and the one most often measured badly. What matters is not how much water is present, but how much of it the plant can actually use, and how much air is left beside it.
Below roughly 8% by volume, much of the water in the rootzone is unavailable at any time: sequestered, trapped, or simply out of reach of roots. At the other end, an abundance of water is no help either — without oxygen the plant shuts down its ability to take that water up and goes into survival mode. Both extremes are unavailable, and both are detrimental.
This is why a number without context is worthless, and why a reading taken at the wrong depth is worse than no reading at all.
| VWC | Behaves like |
|---|---|
| 0 – 8.5% | Sand |
| 8.5 – 10.5% | Loamy sand |
| 10.5 – 12.5% | Sandy loam |
| 12.5 – 15.0% | Silt loam |
| 15.0 – 18.0% | Silt |
| 18.0 – 23.9% | Loam |
| 23.9 – 27.5% | Sandy clay loam |
| 27.5 – 32.5% | Clay loam |
| 32.5 – 36.0% | Silty clay loam |
| 36.0 – 38.5% | Sandy clay |
| 38.5 – 40.5% | Silty clay |
| > 40.5% | Clay |
It is not only soil particle percentages that determine the physical — and chemical — qualities of your rootzone. The behaviour you actually manage is the one in this column.
The 8% fine line
Day-to-day delta should sit within about 8% — a smaller window at lower VWC, a larger one at higher VWC. High fluctuations in moisture from one day to the next confuse the plant and lead to effects nobody wants.
Irrigation decisions made on minutes rather than measured condition are decisions made blind. What matters is where the rootzone actually sits relative to where you want it tomorrow.
Beyond texture, rootzone structure is constantly manipulated by our actions and by nature. Turf naturally adds roughly 22% more material to the rootzone every season. For every 1% increase in water-holding components, the rootzone gains about ten times the water-holding strength.
With so many variables acting on turf, seeing the not-so-obvious — the change before the symptom — is what makes a significant improvement to any management programme.
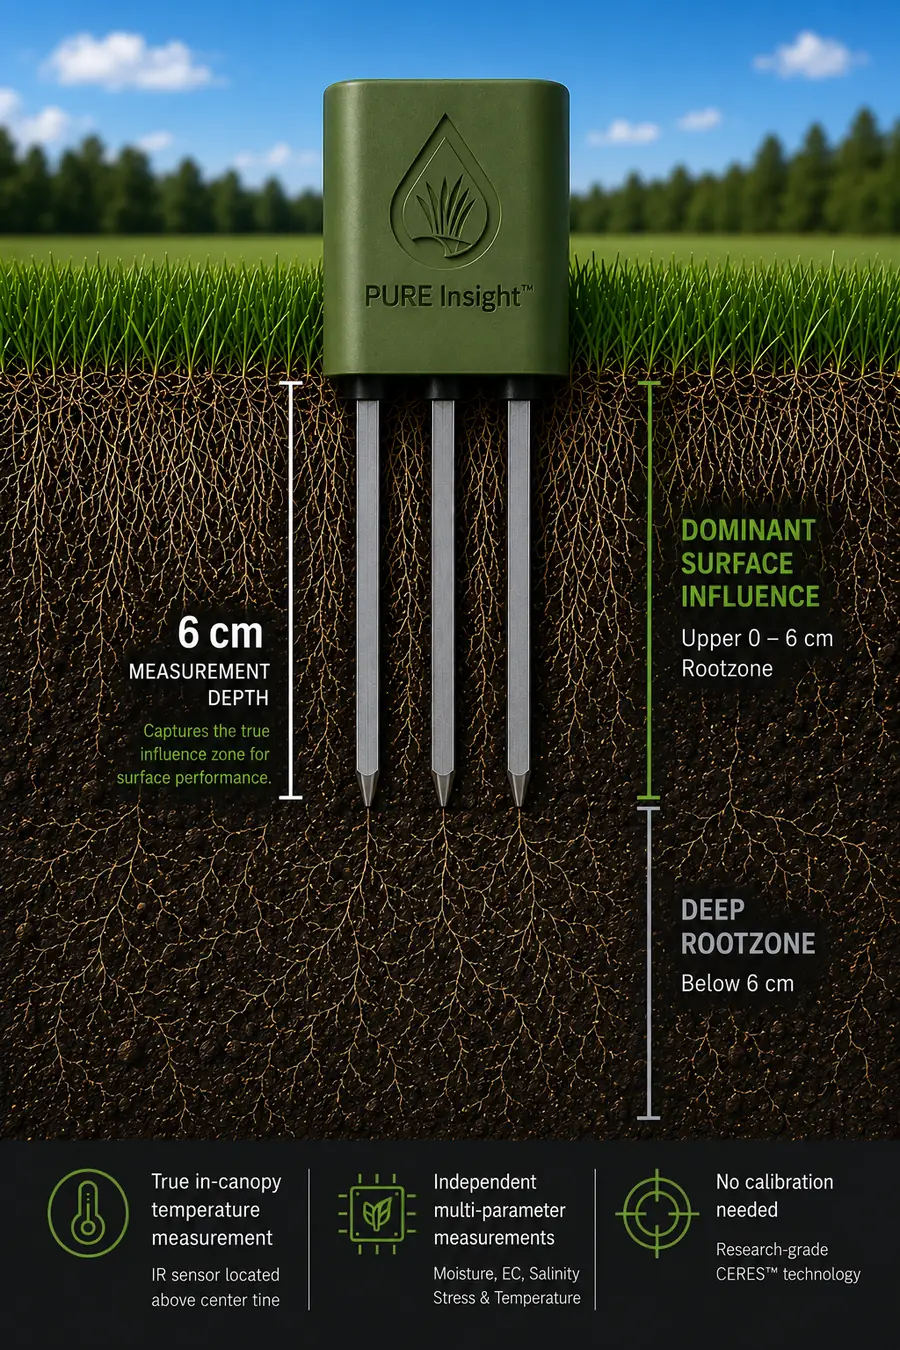
Depth
The strength of the turfgrass upper 6 cm of rootzone outcompetes both the pull of water from evapotranspiration and the drainage of water by gravity. It is the region that decides what the surface does.
Rootzone analysis in 3 cm and 6 cm layers from 0–18 cm shows why: sampling too shallow catches the thatch and the mat rather than the working profile; sampling too deep dilutes the signal with material the surface never feels. Studies show that the region of sampling is as important as the number of samples.
A practical understanding of the rootzone system, and a measurement taken where that system actually operates, is the difference between data and insight.
Sampling
Agricultural Research Manager analysis of mean VWC, standard deviation, standard error of the mean and coefficient of variation gave a clear answer: 15 samples per 368.7 m² produced a standard error statistically similar to 81 samples across the same plot.
That is the practical rule the statistics produce — two to four samples per 93 m². Fewer and the picture is noise; many more and you are spending time for no additional confidence.
A poor pattern with an adequate number of samples still produces a false analysis. So does a good count on a bad pattern. Both the number and the distribution have to be right.
Consistent, vertical insertion to the fixed 6 cm depth is what makes one reading comparable with the next — today, next week, and next season.
Distribution uniformity
Distribution Uniformity has been an industry best-practice measure since the 1990s: the average of the lowest 25% of catch cans divided by the average of all cups, times 100. Carmen Magro adopted it into kriging analysis for turfgrass systems in 2005.
But a catch-can DU tells you about your sprinklers, not about your turf. In a 24-hour analysis of putting green moisture — from 12 hours before irrigation to 12 hours after — a catch-can DU of 73% sat alongside a moisture DU that moved from 72% just before irrigation, to 88% just after, to 79% twelve hours later. Across the day, average moisture DU was 78%.
There was no relationship between the two. If you are managing water by irrigation uniformity alone, you are managing the wrong variable.
Kriging — a geostatistical method dating to Danie Krige’s 1951 work in South African mining — is now available in many mapping tools. Be mindful of the origin of the data and the methods used to interpolate it.
Salinity & temperature
Electrical conductivity measures any ion, positive or negative, in the rootzone solution — which means it is directly related to nutritional ions as well as to salts. Elements vary in size and in activity: good salts and bad salts, ions that accept electron movement and ones that don’t, all influenced by the presence of other elements.
Water quality has a direct, daily impact on EC activity. Know your water quality. And remember the practical conclusion: manage your moisture and you can manage any level of salinity. When a pattern appears, the question is always whether it is salts, or the air and water conditions, producing it.
The rates of photosynthesis and respiration both generally increase with temperature. When photosynthesis exceeds respiration, plants grow. When respiration exceeds photosynthesis, growth slows, stored plant food is consumed, and plants become more susceptible to biotic and abiotic stress.
Optimal growth temperatures: cool-season turfgrass 50–80 °F, warm-season turfgrass 65–95 °F. This is why TOMi™ measures in the canopy, at the canopy/soil interface — where the plant actually experiences temperature, not where an air sensor happens to sit.
Temperature slide content courtesy of Dr. Cale Bigelow.
Measurement methods
There is a place for most of these. The mistake is treating an indirect measurement as if it were a direct one.
Any measurement taken above the surface views symptoms only — it does not measure causes. To correct a problem and avoid it next time, you have to measure the cause. Compare NDVI aerial analysis of moisture against measurement taken from the turf’s own perspective and there is no relationship between the two.
A quick, effective blanket measure of moisture across large areas such as fairways, often alongside mowing. But specifications are determined in sand, professing a 3″ depth from above the surface — and no turf system is sand by definition or physical attribute. Plant material and its density greatly affect penetration, and surface moisture, or its absence, can give a false reading of water the turf can actually use.
Capable of auditing moisture across very large areas. The question for turf is always resolution: what a whole-field average can tell you about a single putting surface that has to perform today.
Emphasis on real-to-imaginary dielectric measurement, elevated frequencies and advanced moisture curve definition — a direct measurement of the relationship between real dielectric permittivity and impedance, tunable and variable. This is the family of physics the Ceres™ sensor builds on, tuned specifically for the turfgrass rootzone.
Playability
Ongoing research pairs volumetric water content with stimpmeter ball speed and firmness measurement — using a precision putting green firmness compaction meter, and a Clegg hammer at the Fife, Scotland site.
The relationships are curvilinear rather than linear: although weakly correlated, there is a clear indication that moisture relates to both firmness and ball speed, and that an optimal moisture may be needed to reach optimal ball speed or firmness — and to sustain it for longer. Unmeasured variables such as cut quality and turf vigour likely matter significantly too.
Research is ongoing to evaluate these relationships further, including ambient influences.

Further reading
Carmen’s 2025 guide, A comprehensive guide to understanding the vitality of turf and how to monitor it for best decisions, sets out this material in full.